


Climate Change
Climate change is not a scenario anymore. People are influencing the climate by burning fossil fuels, cutting down forests, and practicing increasingly intensive and large‐scale agriculture. This adds enormous amounts of greenhouse gases to the atmosphere, which leads to global warming and other climate changes.
CO2 is the greenhouse gas most commonly produced by human activities and it is responsible for 64% of man‐made global warming. Its concentration in the atmosphere is currently 40% higher than it was when industrialisation began. As populations, economies, and standards of living grow, so does the level of greenhouse gas emissions.
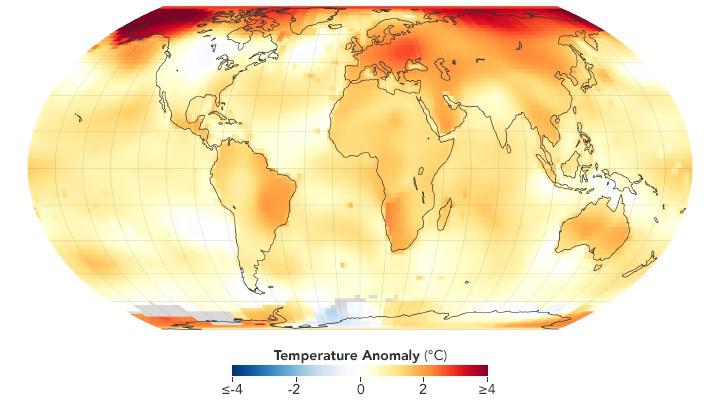
The year 2019 was the second warmest year in the 140‐year record. The five warmest years in the 1880–2019 record have all occurred since 2015, while nine of the 10 warmest years have occurred since 2005.
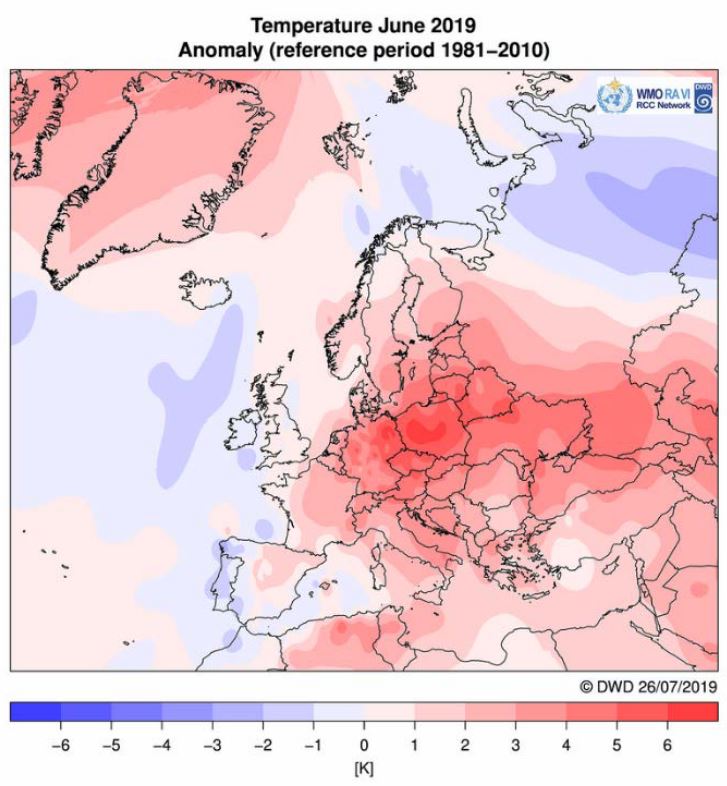
Heat anomaly in Europe, June 2019
The average monthly temperature in June 2019 was above normal (that is the 1981-2010 average). The temperature increase was particularly observed over Central and Eastern Europe with anomalies around +3 to +6°C. In Eastern and Central Europe warm temperatures dominated for the month as a whole, additionally experiencing short but intense heat waves. Around the middle of the month temperature, the first heatwave hit Eastern Europe. In Poland, for example, over much of the country's temperatures exceeded 30 °C during several days.
Climate Change, Exposure, and Impacts
The effects of climate change are being observed in the changes in temperature, precipitation quantity and timing, and seasonal patterns. Additionally, climate change-related impacts, disasters, and corresponding risks for humans have been explored. These issues were examined more in-depth in three biosphere reserves: Desnianskyi, Roztochya, and Shatskyi.
To get detailed information on the changes in air temperature for each biosphere reserve, press on the “Changes in air temperature” dropdown menu. For more information on precipitation changes, click on the “Changes in precipitation quantity and patterns” dropdown menu. To learn more about how climate change affects human well-being, what impacts and disaster risks it creates, click on the “Climate change-related impacts, disasters, and human risks” dropdown below.
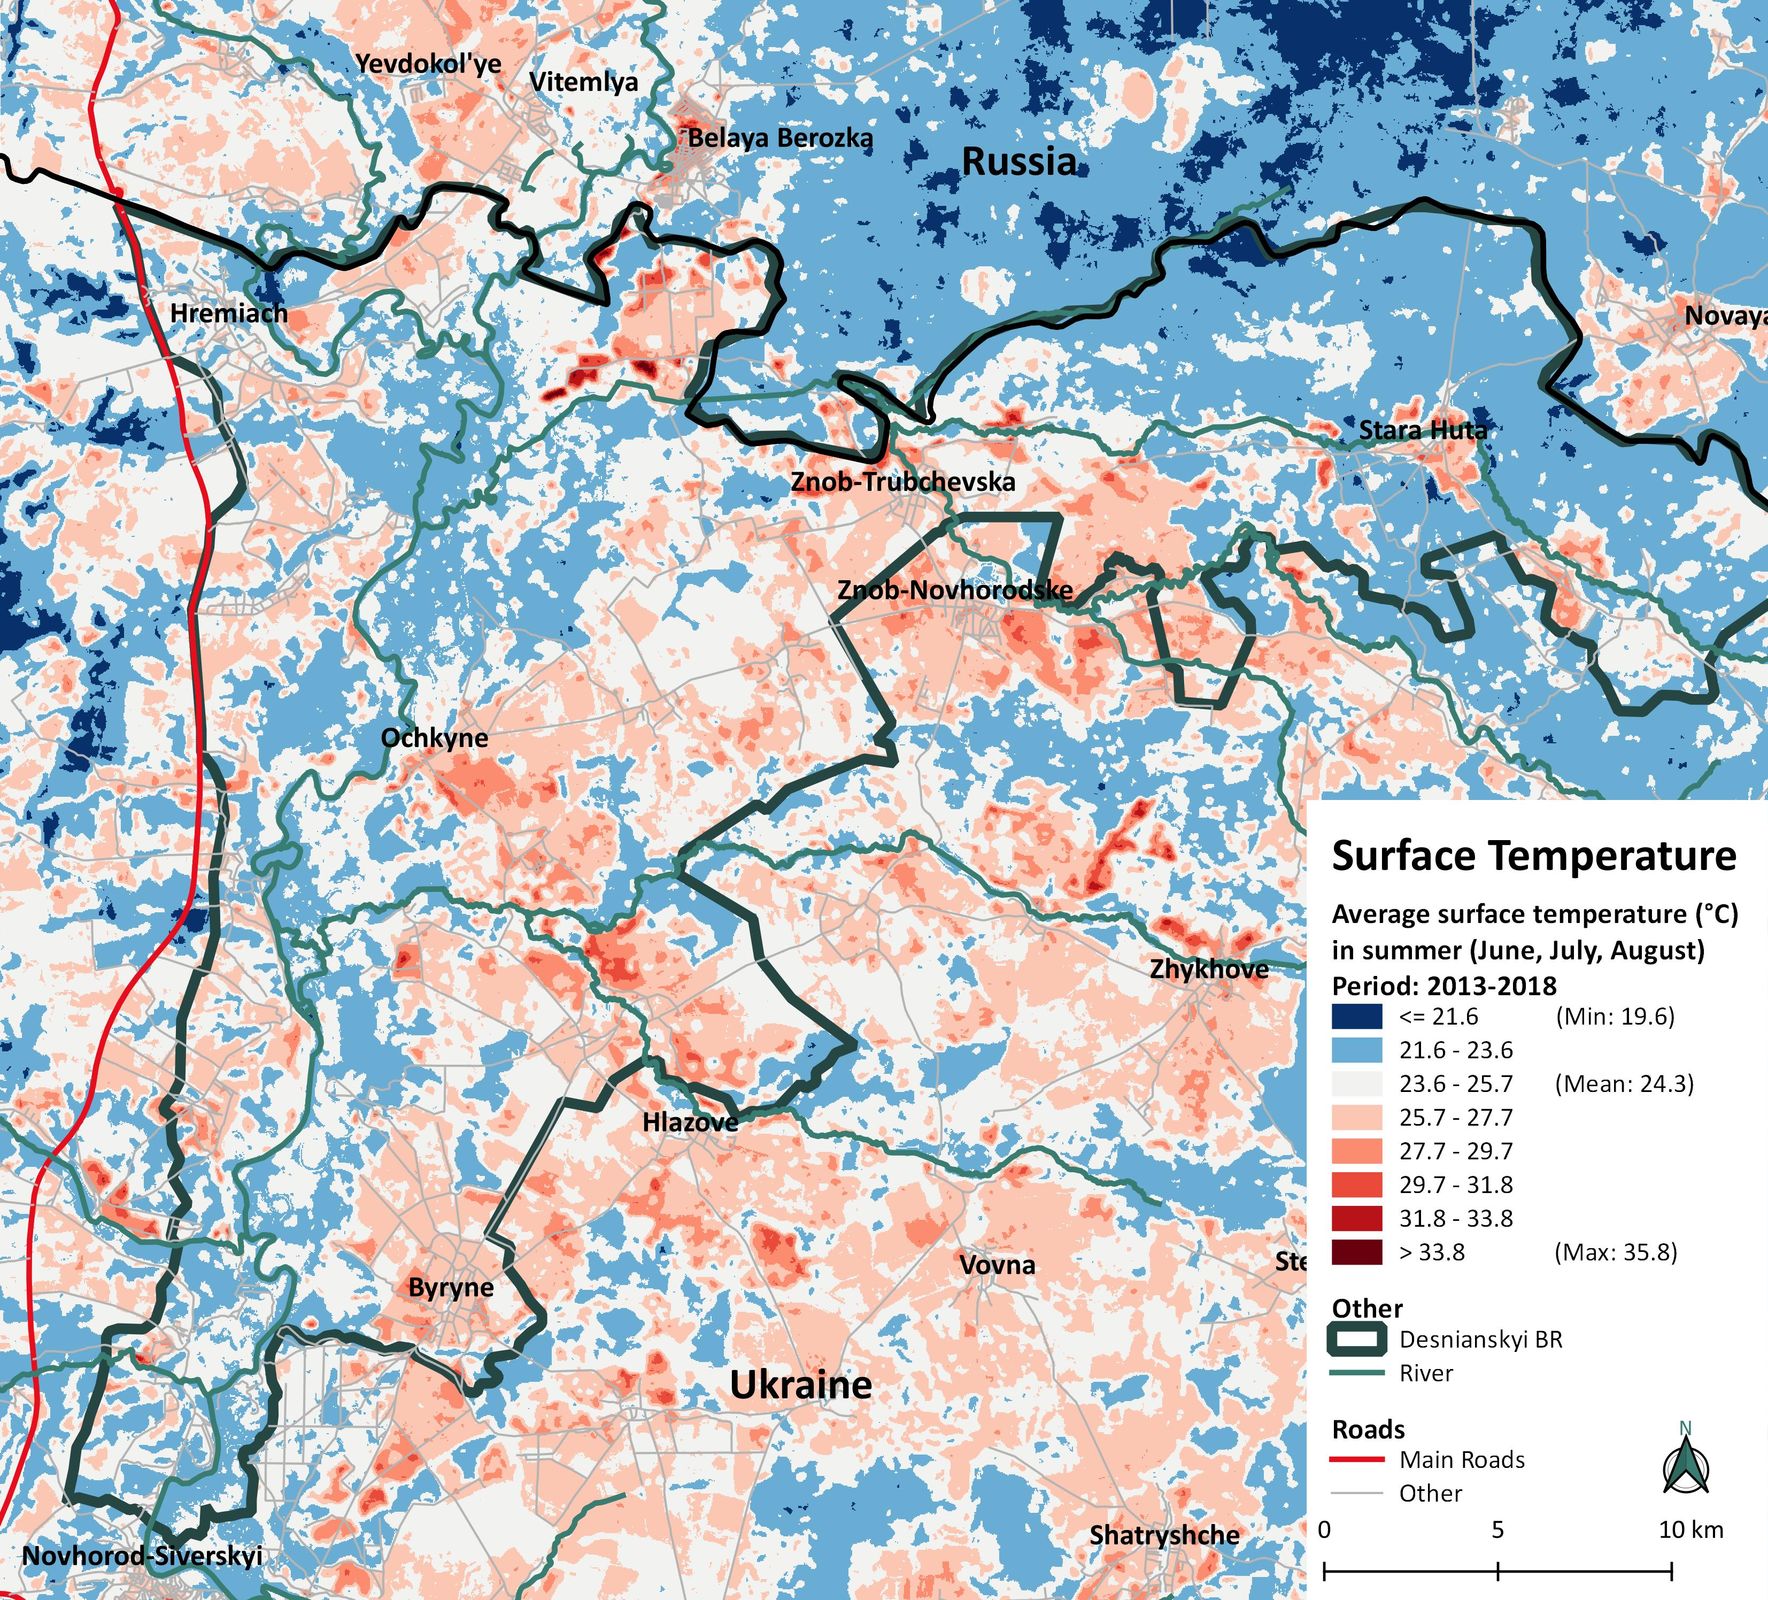
Climate Change, Exposure, and Impacts in Desnianskyi Biosphere Reserve
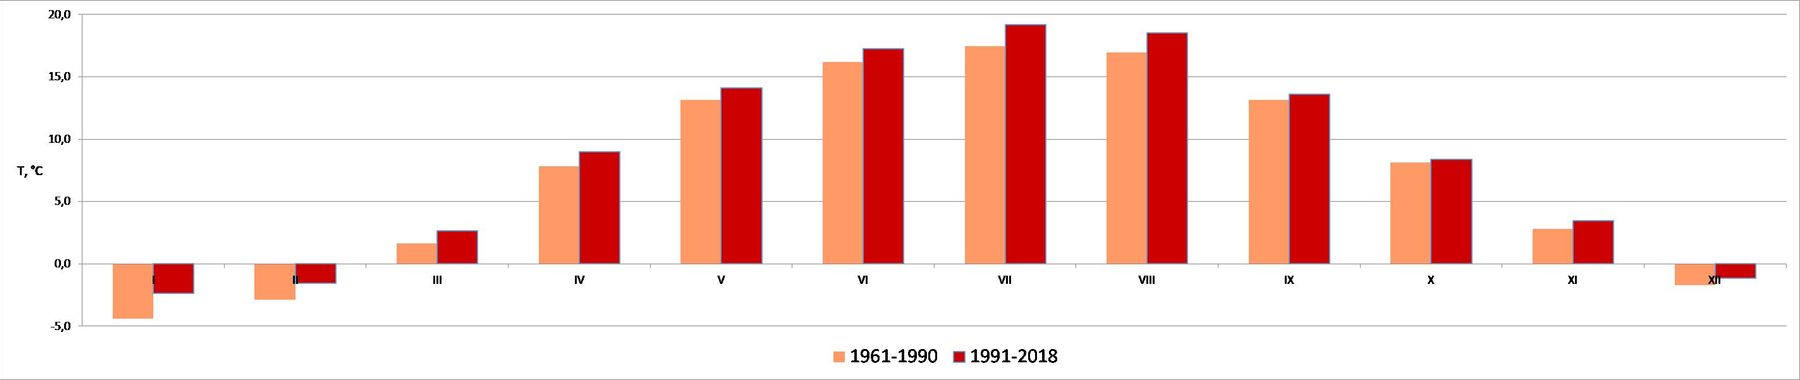
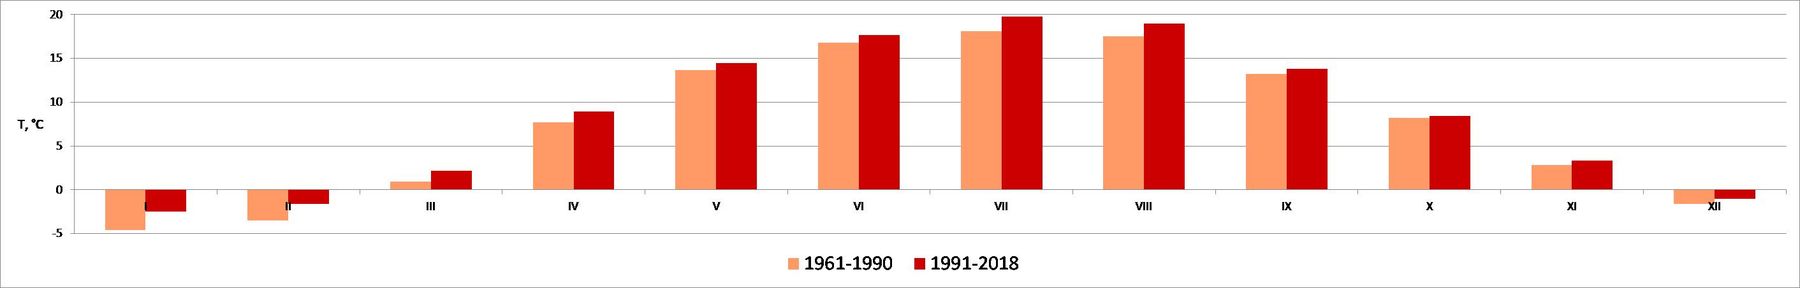
During the climatic normal period between 1961 and 1990 (standard reference) the average annual air temperature was about 5.8 °C. It reached the maximum of 7.8 °C in 1975 and 1989. In the last 28 years (1991-2018) the mean annual temperature increased to 6.9 °C, i.e. by 1.1 °C. It has been particularly high since 2007 with a peak of 8.1 °C in 2015. The mean monthly temperature of the coldest and hottest months (i.e. January and July) in the periods of 1961-1990 and 1991-2018 were 8.2 vs -5.4 °C and 17.5 vs 19.7 °C respectively.
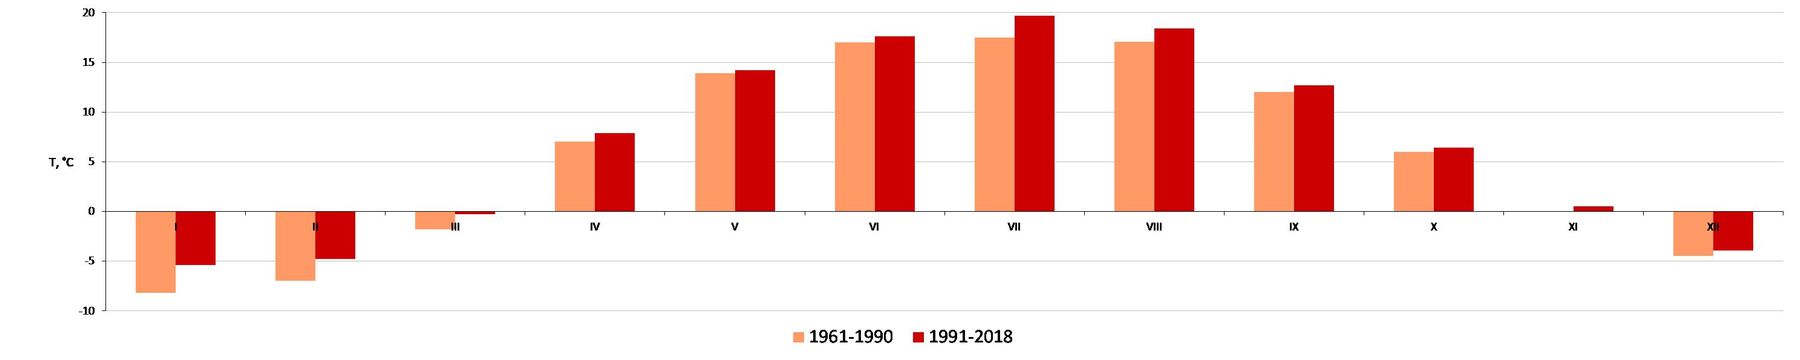
The highest increase in mean monthly temperatures in comparison to the climatic normal was observed for the winter and summer periods along with March (see graph 1). Moreover, this trend has accelerated in the recent five years (2014-2018) when the highest temperature rise was calculated as more than 3 °C for February and March. It was particularly hot in July of 2014, 2016 and 2018, when the average air temperature exceeded 20 °C, which corresponds to the past long-term average of Central Ukraine (e.g., Dnipro city). In 2017 and 2018 the summer days (maximum daily temperature exceeds 25 °C) were observed as earliest as in April, which is one more evidence of recent climate change in the region.
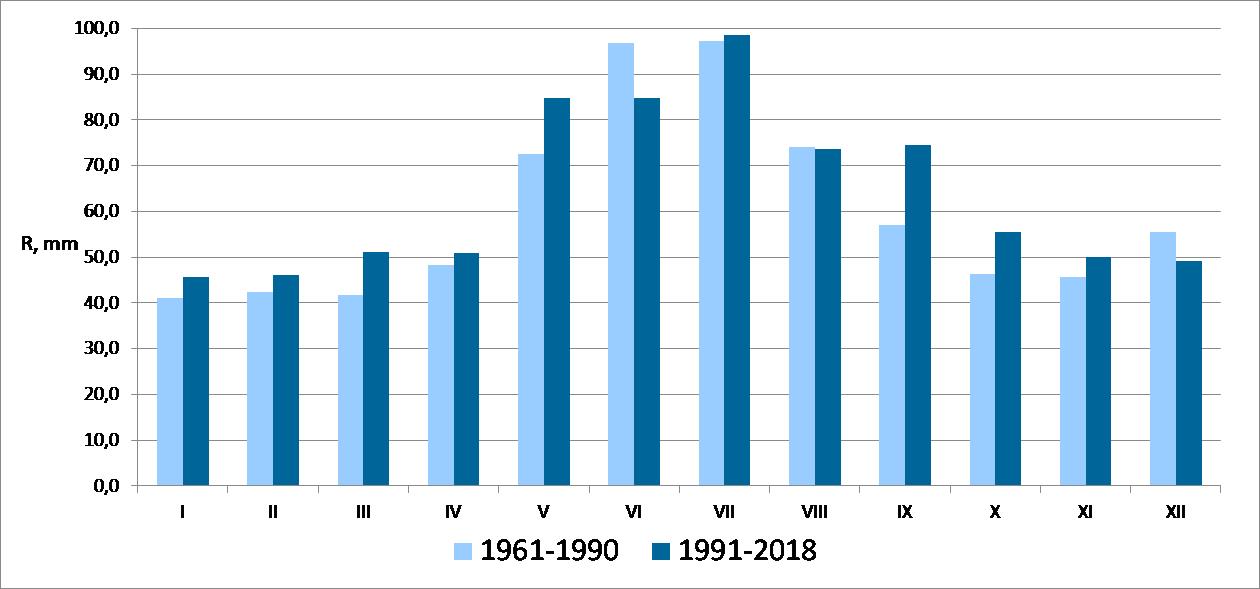
The average annual amount of precipitation in the region of the biosphere reserve in comparison to the reference period and the last three decades remained almost the same – 634 and 632 mm. However, in three out of five years between 2014 and 2018, there was less than 500 mm of precipitation. Most precipitation still falls during the summer season, but there are some changes in volume throughout the year. Between 1991 and 2018, a substantial decrease in the amount of rainwater was recorded for June and August, 14 and 13 mm respectively, compared to the climatic normal. The only month which showed a considerable increase in precipitation was October with 17 mm of surplus.
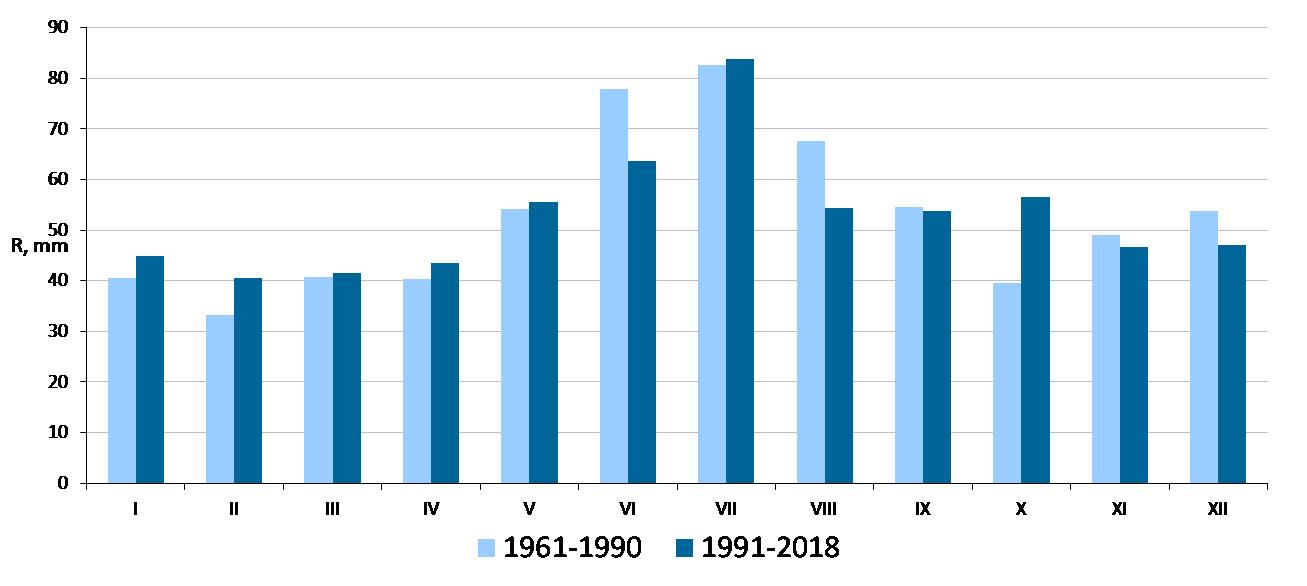
During the last five years, an average duration of a dry period was 12 days per month, with the longest being between August and November (16-17 days). The highest one-day precipitation usually falls from May to July with an average of 20-30 mm over 24 hours. Its absolute maximum was recorded in July 2018 with 56 mm/day, which was 60 % of the entire rainwater that month. The period between May and July is also characterized by the most frequent heavy and extremely heavy rains. Due to the air temperature developments, particularly in winter season, in recent years more and more precipitation came as rain rather than snow, which has impacted the flooding regime in spring.
Projection for the future
According to the most probable climate development scenario for the Desnianskyi region (A1B scenario of IPCC) the mean annual temperature is expected to increase by 2.5 °C by the end of the 21st century in comparison to 2000-2010 average. It also indicates an increasing variability of the amount of precipitation, which might be challenging for the development of sustainable and adapted agriculture and forestry in the region.
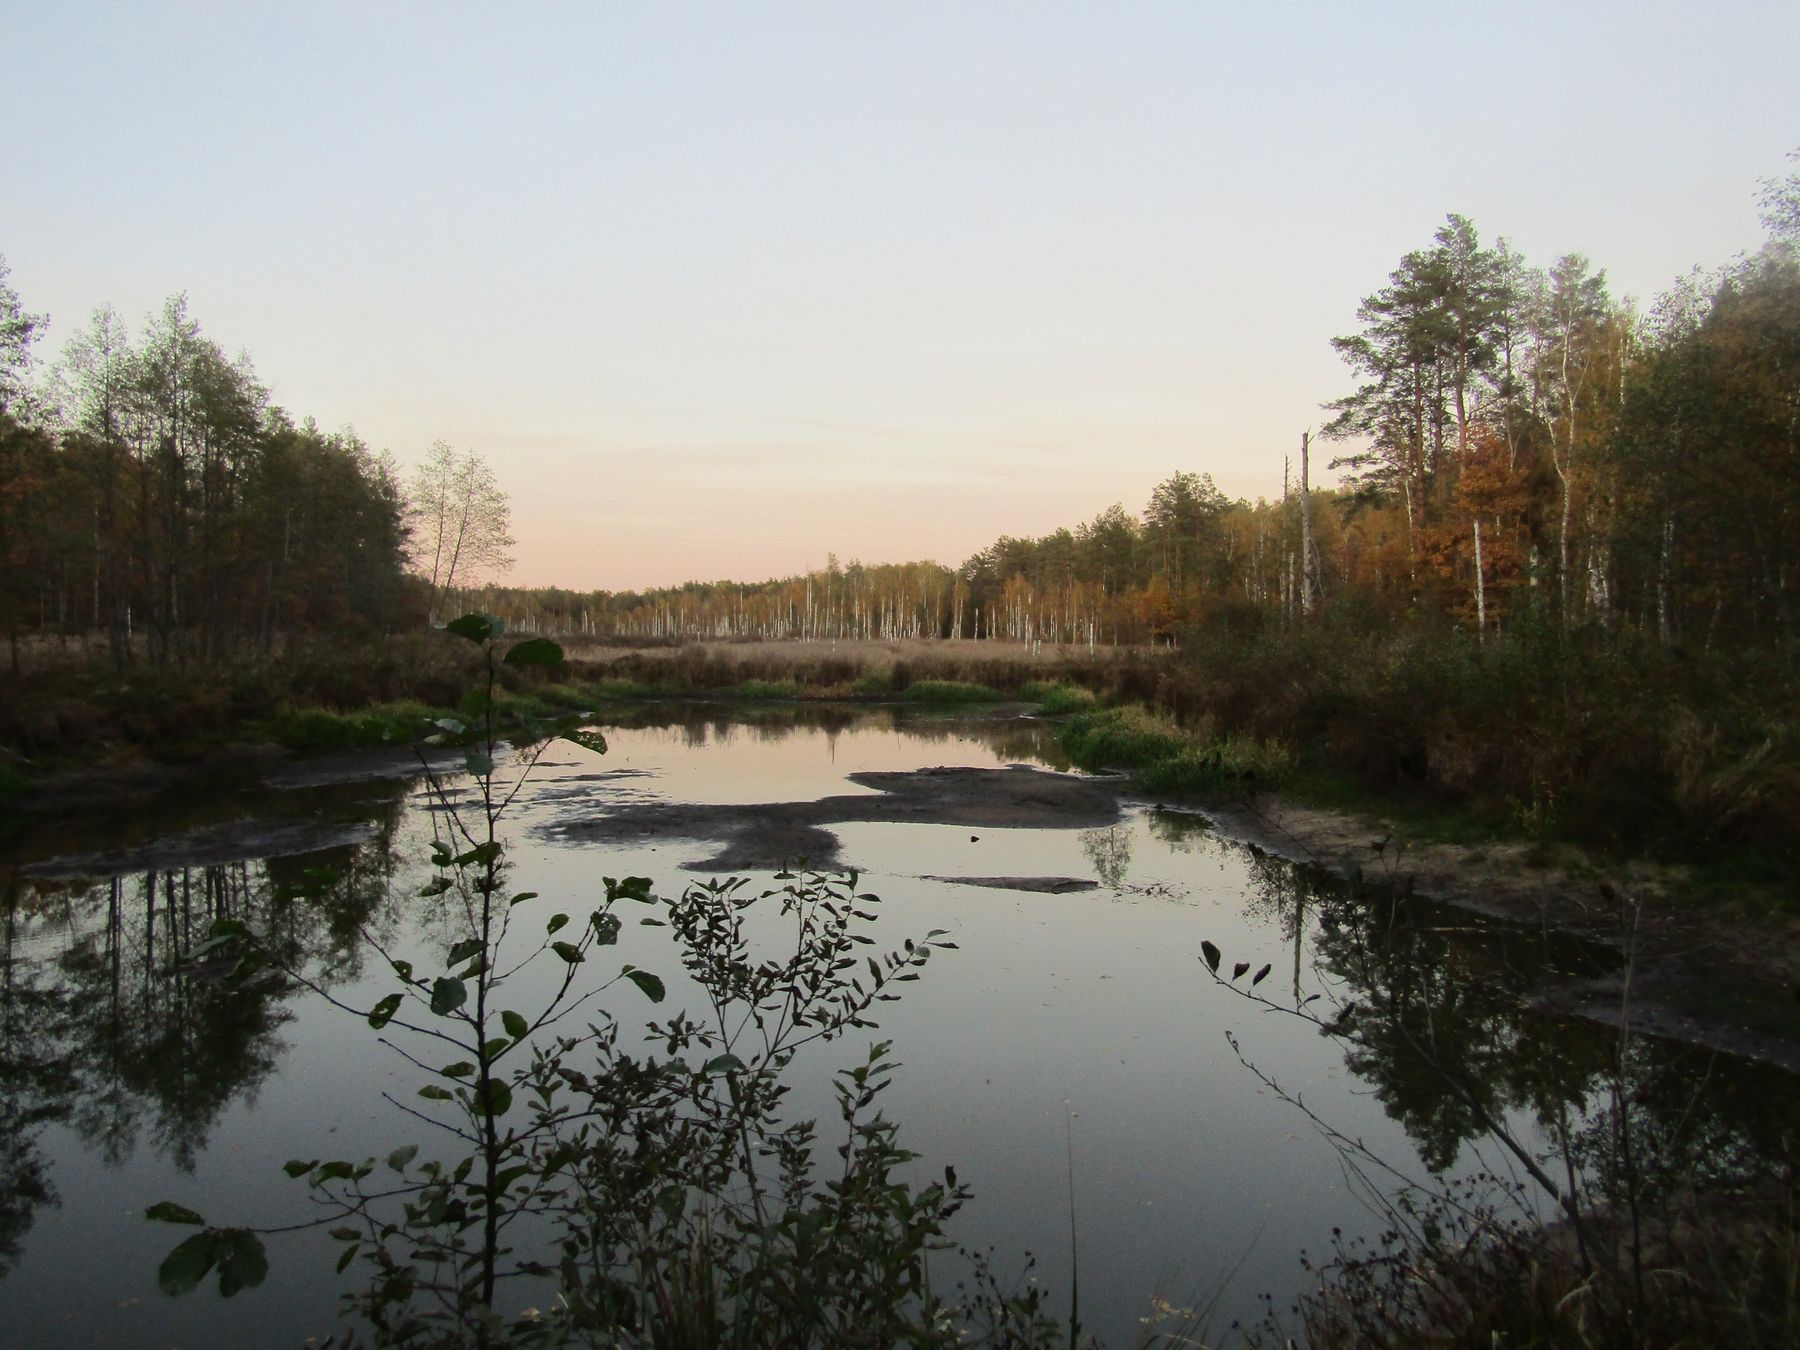
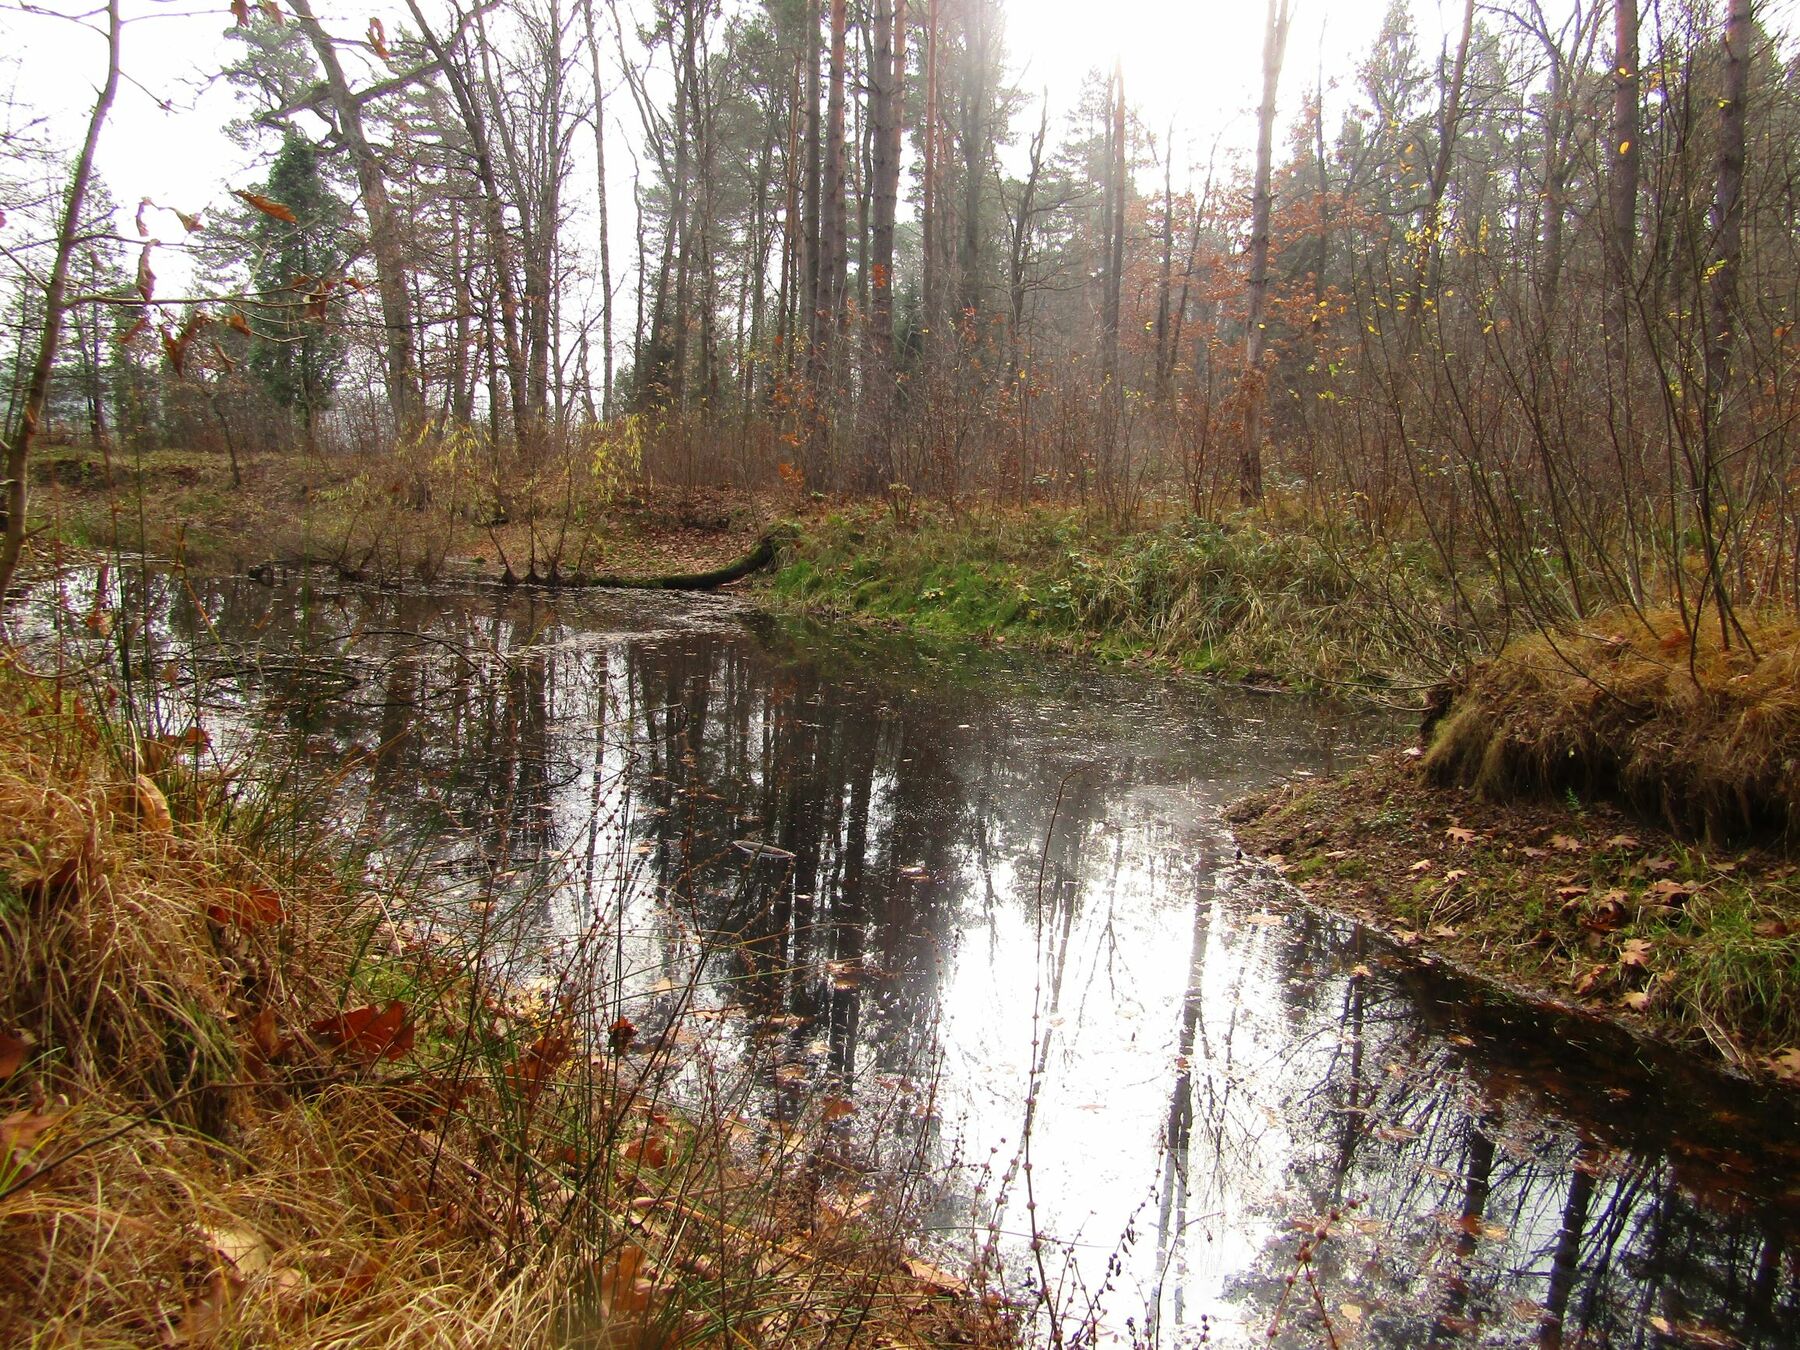
Increasing average temperatures, hot days, and drought periods, drive evaporation and transpiration rates of water-bodies, soils, and plants, leading to landscape dehydration. Combined with changes in quantity and timing of precipitation, higher runoff rates, and unsustainable water use by agriculture and private households, the water balance is additionally under pressure. Wetlands cannot recover and continue drying out.
Key impacts:
- Decreased levels of surface and groundwater: becoming evident in shallowing and drying of Desna river, Desna river tributaries, lakes, ponds, and wells
- Changed flood regime patterns
- Polluted surface- and groundwater
Humans at risk:
- More frequent heat waves endanger the health of people, especially of sensitive groups. Not only humans but also plants and animals are stressed by heat, weaken, or die.
- Respiratory and cardiovascular diseases can result from heat or thermal stress.
- Risk of fire
- Waterborne diseases
- Diminishing quality and quantity of drinking water
- Water supply shortages
Forests, meadows, and agricultural lands are increasingly suffering from dehydration. The combination of dryer conditions due to climate change and unsustainable water use by humans increases the risk and occurrence of forest-, peat bog-, swamp-, field- and meadow fires.
Humans at risks:
- Drying of peat bogs, forest, and arable land entailing frequent fires can spur the amount of allergic and asthmatic diseases in the region.
- Air pollution due to particles released into the atmosphere during fires can cause cardiovascular and pulmonary diseases and death.
- Higher risk of wildfires - direct loss of lives and damages to infrastructure
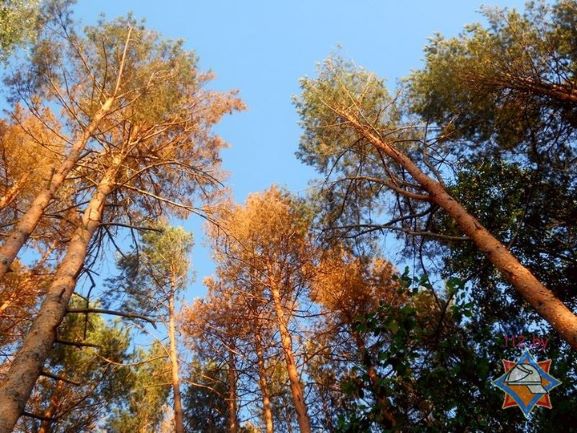
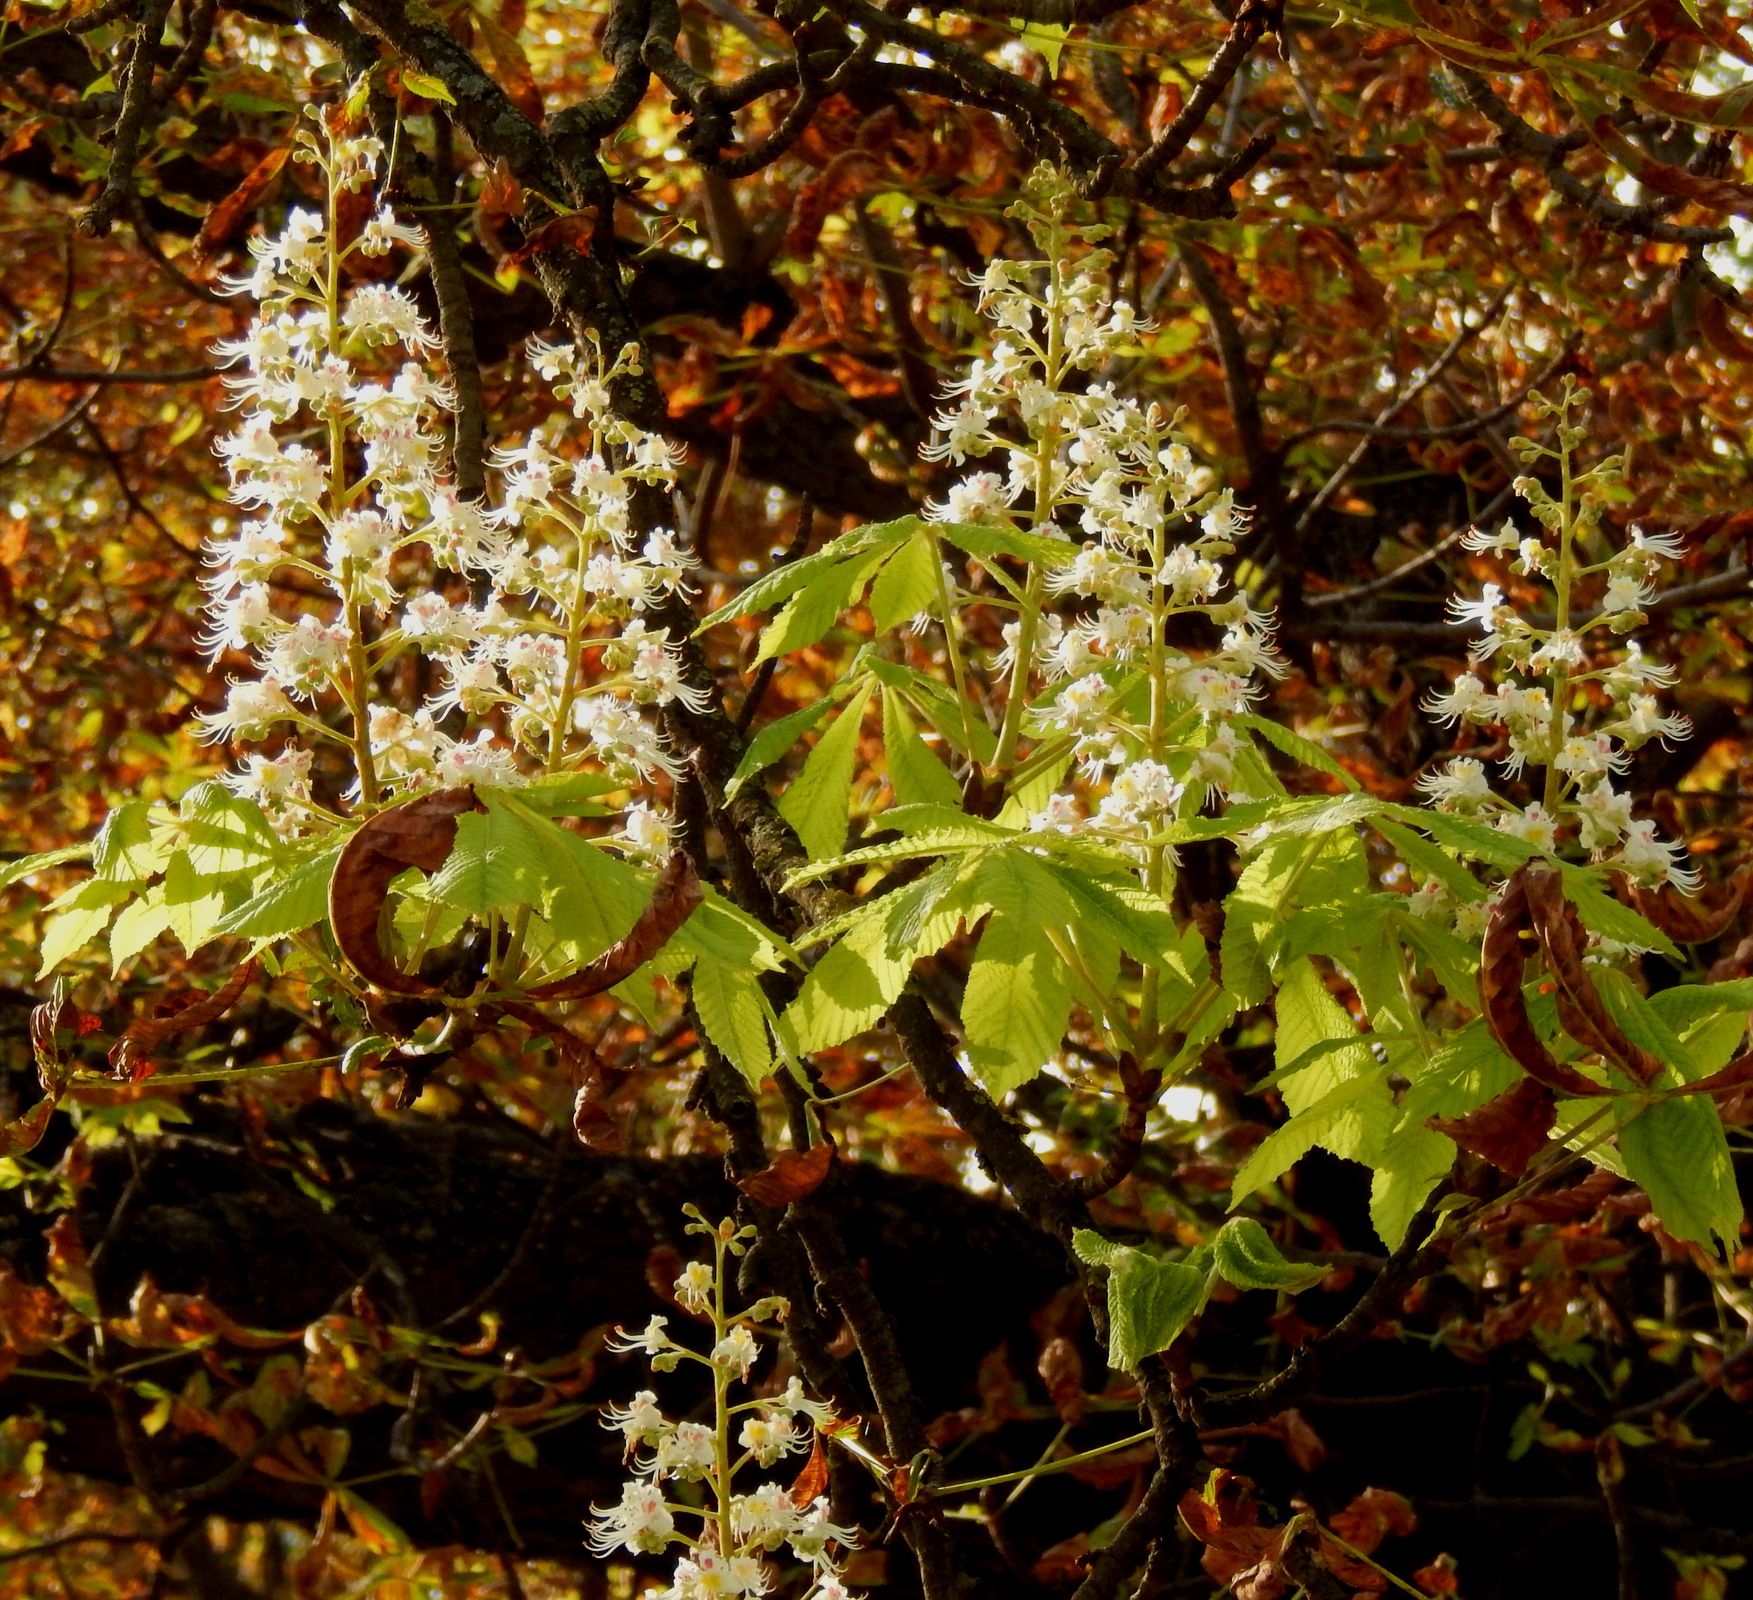
Changes in wildlife, plant populations, and habitats are occurring. This includes the appearance of alien species, while the living conditions of native plant and animal species are deteriorating. A growing number of the spread of pests, diseases, and insect calamities are observed mostly in forest and agricultural ecosystems. Higher levels of insect populations destroying trees and crops are found in arid arrays. Monoculture pine forests are very vulnerable - the bark beetle population has now become a major threat to these stands.
Humans at risk:
- Diarrhea and infectious diseases, in which the pathogens are transmitted e.g. by mosquitoes or ticks (tick-borne borreliosis - Lyme disease, and encephalitis), are two disease patterns that can occur more frequently as the temperature gradually rises.
- Forest produce and crop damage and loss
- Increasing cases of allergies and allergic shocks
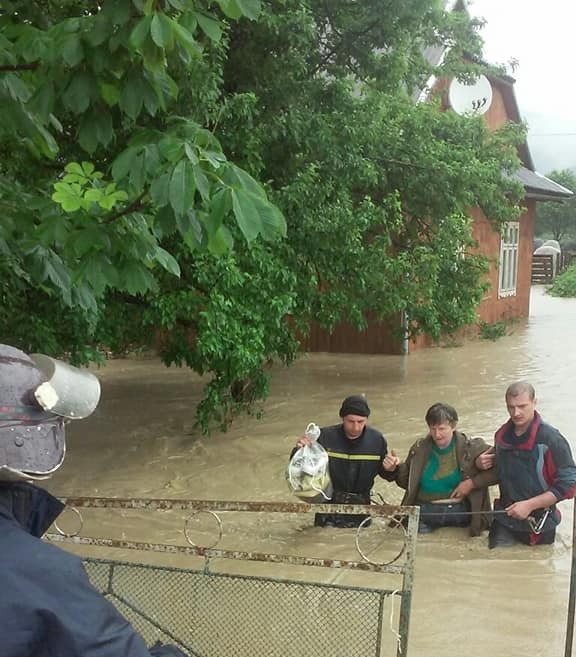
Climate change also drives an increase in the number of dangerous weather phenomena, such as storms, heatwaves, flooding, hail- and sandstorms, frosts, and icing in late spring. The ecosystems and humans, forming part of them, are affected at different levels, space, and time by the manifold consequences of such events.
Humans at risk:
- Direct damage to physical (and mental) well-being. e.g. flooding can cause mold/dampness provoking cough, phlegm, respiratory problems, and allergic reactions
- Damage to infrastructure, houses, and private property
- Damages to crops and harvest
- Power supply shortages
- etc.
-
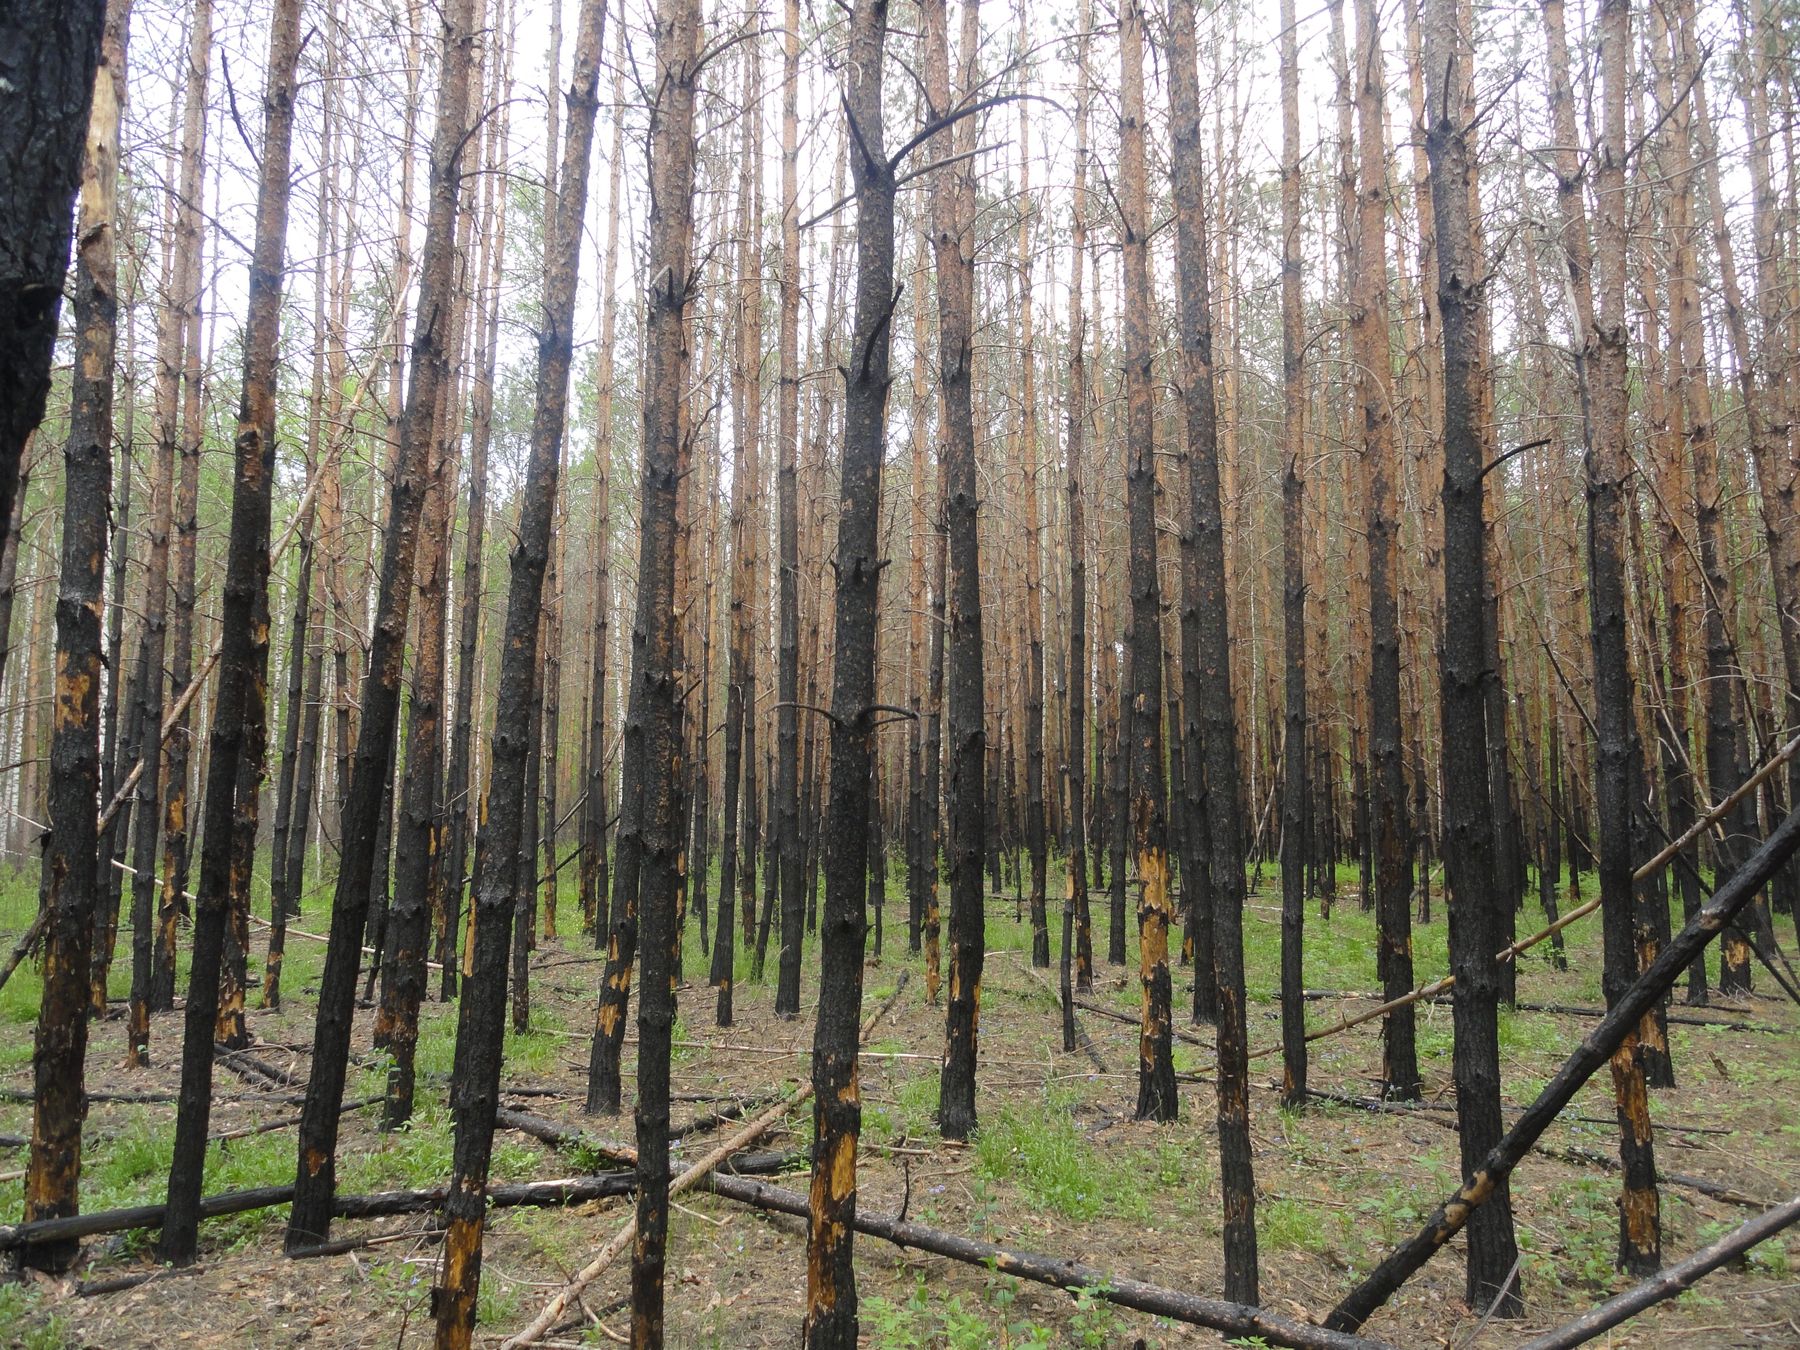
Vulnerable pine monoculture plantation damaged by bark beetle (ips acuminatus) © Desnianskyi BR -

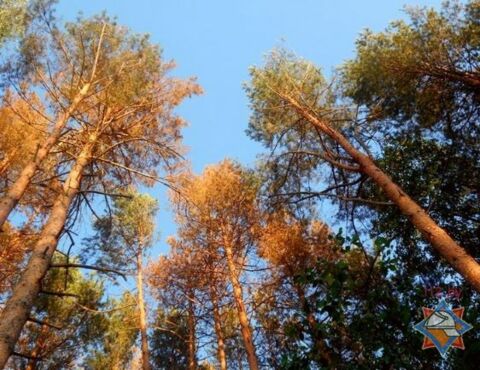
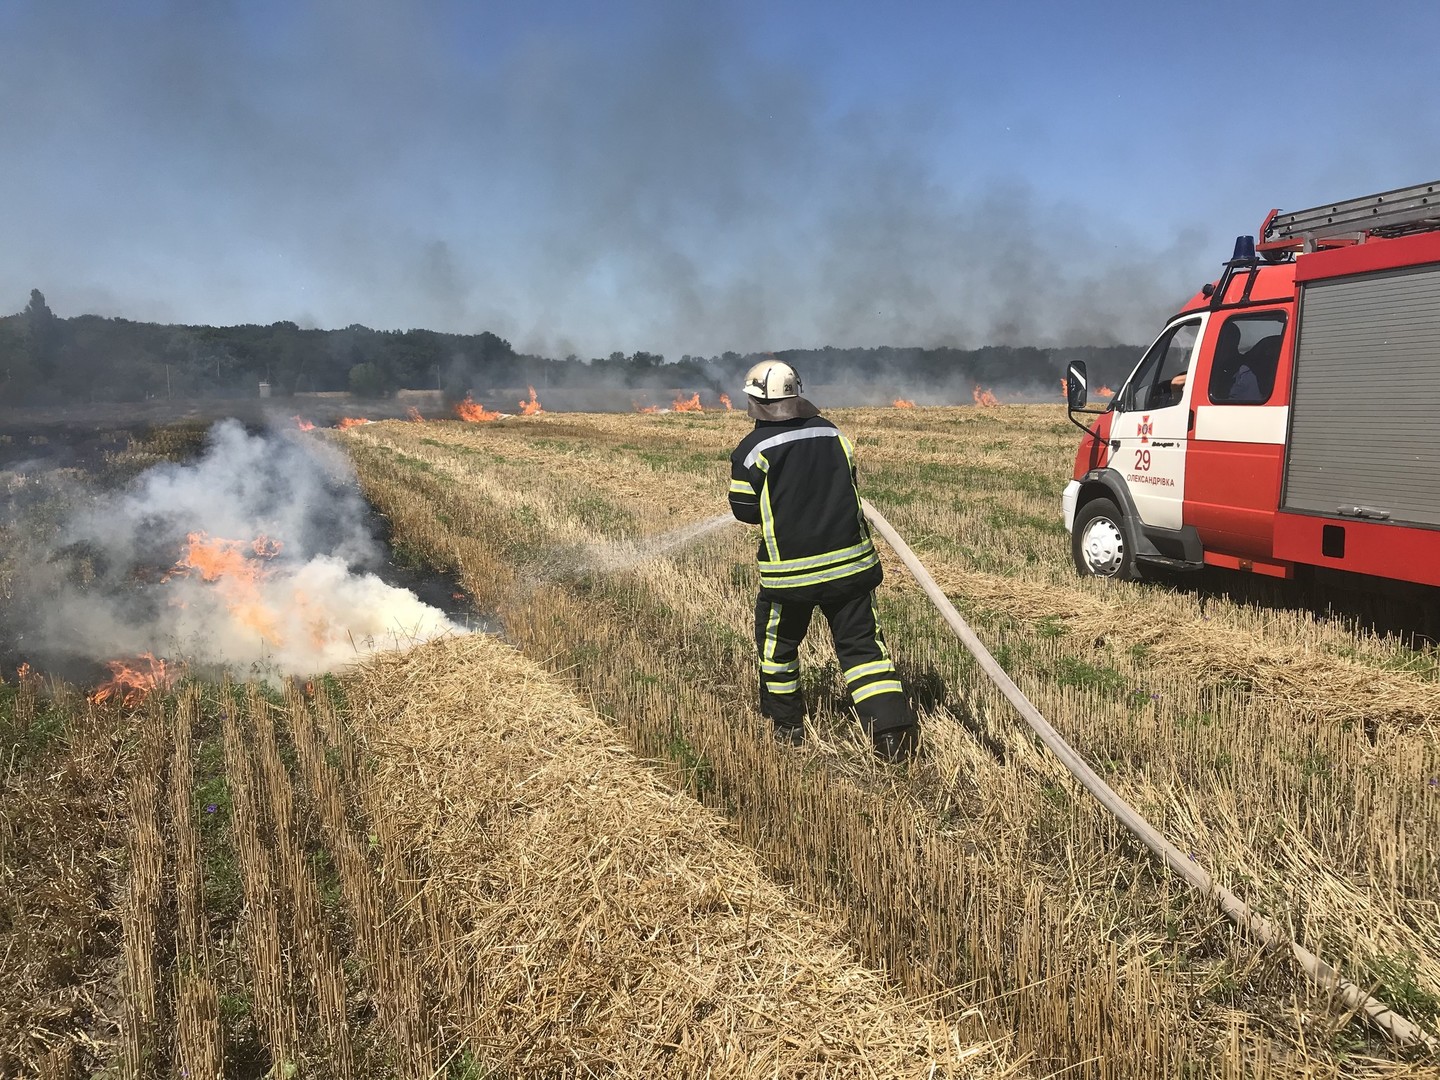
Extinguishing a cropland wildfire (CC4.0) State Emergency Service of Ukraine
Climate Change, Exposure, and Impacts in Roztochya Biosphere Reserve
During the normal climatic period between 1961 and 1990 (standard reference) the average annual air temperature was about 7.4 °C. It reached the maximum of 9.0 oC (Rava-Ruska) and 9.1 °C (Yavoriv) in 1989. In the last 28 years (1991-2018) the mean annual temperature increased to 8.4 °C, i.e. by 1.0 °C. It has been particularly high since 2014 with a peak of 10.0 °C in 2015 for Yavoriv. The mean monthly temperature of the coldest and hottest months (i.e. January and July) in the periods of 1961-1990 and 1991-2018 were -4.4 vs -2.4 °C and 17.5 vs 19.2 °C respectively.
The highest increase in mean monthly temperatures in comparison to the climatic normal was observed for the winter (January & February) and summer months (July & August) (see the graph). Moreover, this trend has accelerated in the recent five years (2014-2018) when the highest temperature rise was calculated as more than 2.5 °C for December, August and February. It was particularly hot in August 2015 and July of 2014, when the average air temperature reached 21.5 and 20.5 °C respectively, which corresponds to the past long-term average of Central-Eastern Ukraine within steppe zone. In 2018 the summer days (maximum daily temperature exceeds 25 °C) were observed as early as in April, which is an additional evidence of the recent climate change in the region.
The average annual amount of precipitation in the region of the biosphere reserve compared to the reference period and the last three decades increased by almost 6 % – from 719 to 765 mm. However, eight out of ten years between 2009 and 2018 there had amount of precipitation close to the long-term average of 1961-1990. Most precipitation still falls during the summer season, but there are some changes in volume throughout the year. Between 1991 and 2018, a substantial decrease in the amount of rainwater was recorded for June and December, while in September, May and March there was recorded a substantial surplus of water compared to the climatic normal. The lowest changes in precipitation pattern showed July and August.
During the last five years, an average duration of a dry period was 9 days per month, with the longest consecutive period of 35 days in August - September 2015. The highest one-day precipitation usually falls in May - July and September - October with an average amount of 20-30 mm over 24 hours. Its absolute maximum was recorded in October 2016 with 69 mm/day, which was 146 % of the long-term average for that month. An average number of days with extremely heavy rains (R>20 mm) in Roztochya BR is the highest amongst other reserves and equals six. Due to the air temperature developments last winter seasons were featured by absent of stable snow cover while most of precipitation came as rain rather than snow.
Projection for the future
According to the most probable climate development scenarios for the Roztochya region (B1 and A2 scenario of IPCC) the mean annual temperature is expected to increase by 2.1 and 4.6 °C respectively by the end of the 21st century in comparison to 2000-2010 average. They also indicate an increasing variability of the amount of precipitation, which might be challenging for the development of sustainable and adapted agriculture and forestry in the region.
In recent years, besides a shift of seasons and changing wind directions, the area is facing increasing average temperatures, number of hot days, new maximum temperatures, heatwaves, and droughts. Sealed surfaces, biomass- and diversity-poor, managed agricultural, forest, and urban ecosystems contribute greatly to heating of the land surface.
This creates both constant and periodical stress for flora and fauna in multiple ways: besides direct heat and dry stresses, these events and changing conditions drive evaporation and transpiration rates of water-bodies, soils, and plants, leading to landscape dehydration. Combined with changes in quantity and timing of precipitation, higher runoff rates, and unsustainable water use by agriculture and private households, the water balance is additionally under pressure.
Key impacts:
- Decreased levels of surface and groundwater are becoming evident in shallowing and drying of wetlands, springs, rivers, wells, forests, and water reservoirs
- Decreasing soil moisture
- Polluted surface- and groundwater, and accumulation of pollutants in bottom sediments
- Reduced cooling functions of ecosystems
Humans at risk:
- More frequent heat waves endanger the health of people, especially of sensitive groups. Not only humans but also plants and animals are stressed by heat, weaken, or die
- Respiratory and cardiovascular diseases can result from heat or thermal stress
- Higher risk of fire
- Waterborne diseases
- Diminishing quality and quantity of drinking water
- Water supply shortages
Climate change and land use drive alterations in habitats, wildlife, plant and animal populations and species. A decrease in native plant and animal species due to a variety of morbidity causes is observed while alien and invasive species are appearing. New and more frequent pests, diseases, insect calamities, and allergens are observed, especially in forest and agricultural ecosystems. Overall, a reduction in biodiversity is occurring which is further accelerated by pressure from human land-use.
Humans at risk:
- Diarrhea and infectious diseases, in which the pathogens are transmitted e.g. by mosquitoes or ticks (tick-borne borreliosis - Lyme disease, and encephalitis), are two disease patterns that can occur more frequently as the temperature gradually rises.
- Forest produce and crop damage and loss due
- Increasing cases of allergies and allergic shocks
Climate change also drives an increase in the number of dangerous weather phenomena, such as storms, heat waves, torrential rain and flooding, thunder-, hail- and sandstorms, frosts, and icing in late spring. The ecosystems and humans, forming part of them, are affected at different levels, space, and time by the manifold consequences of such events.
Humans at risk:
- Direct damage to physical (and mental) well-being: e.g. flooding can cause mold/dampness provoking cough, phlegm, respiratory problems, and allergic reactions
- Damage to infrastructure, houses, and private property
- Damages to crops and harvest
- Power supply shortages
- Etc.
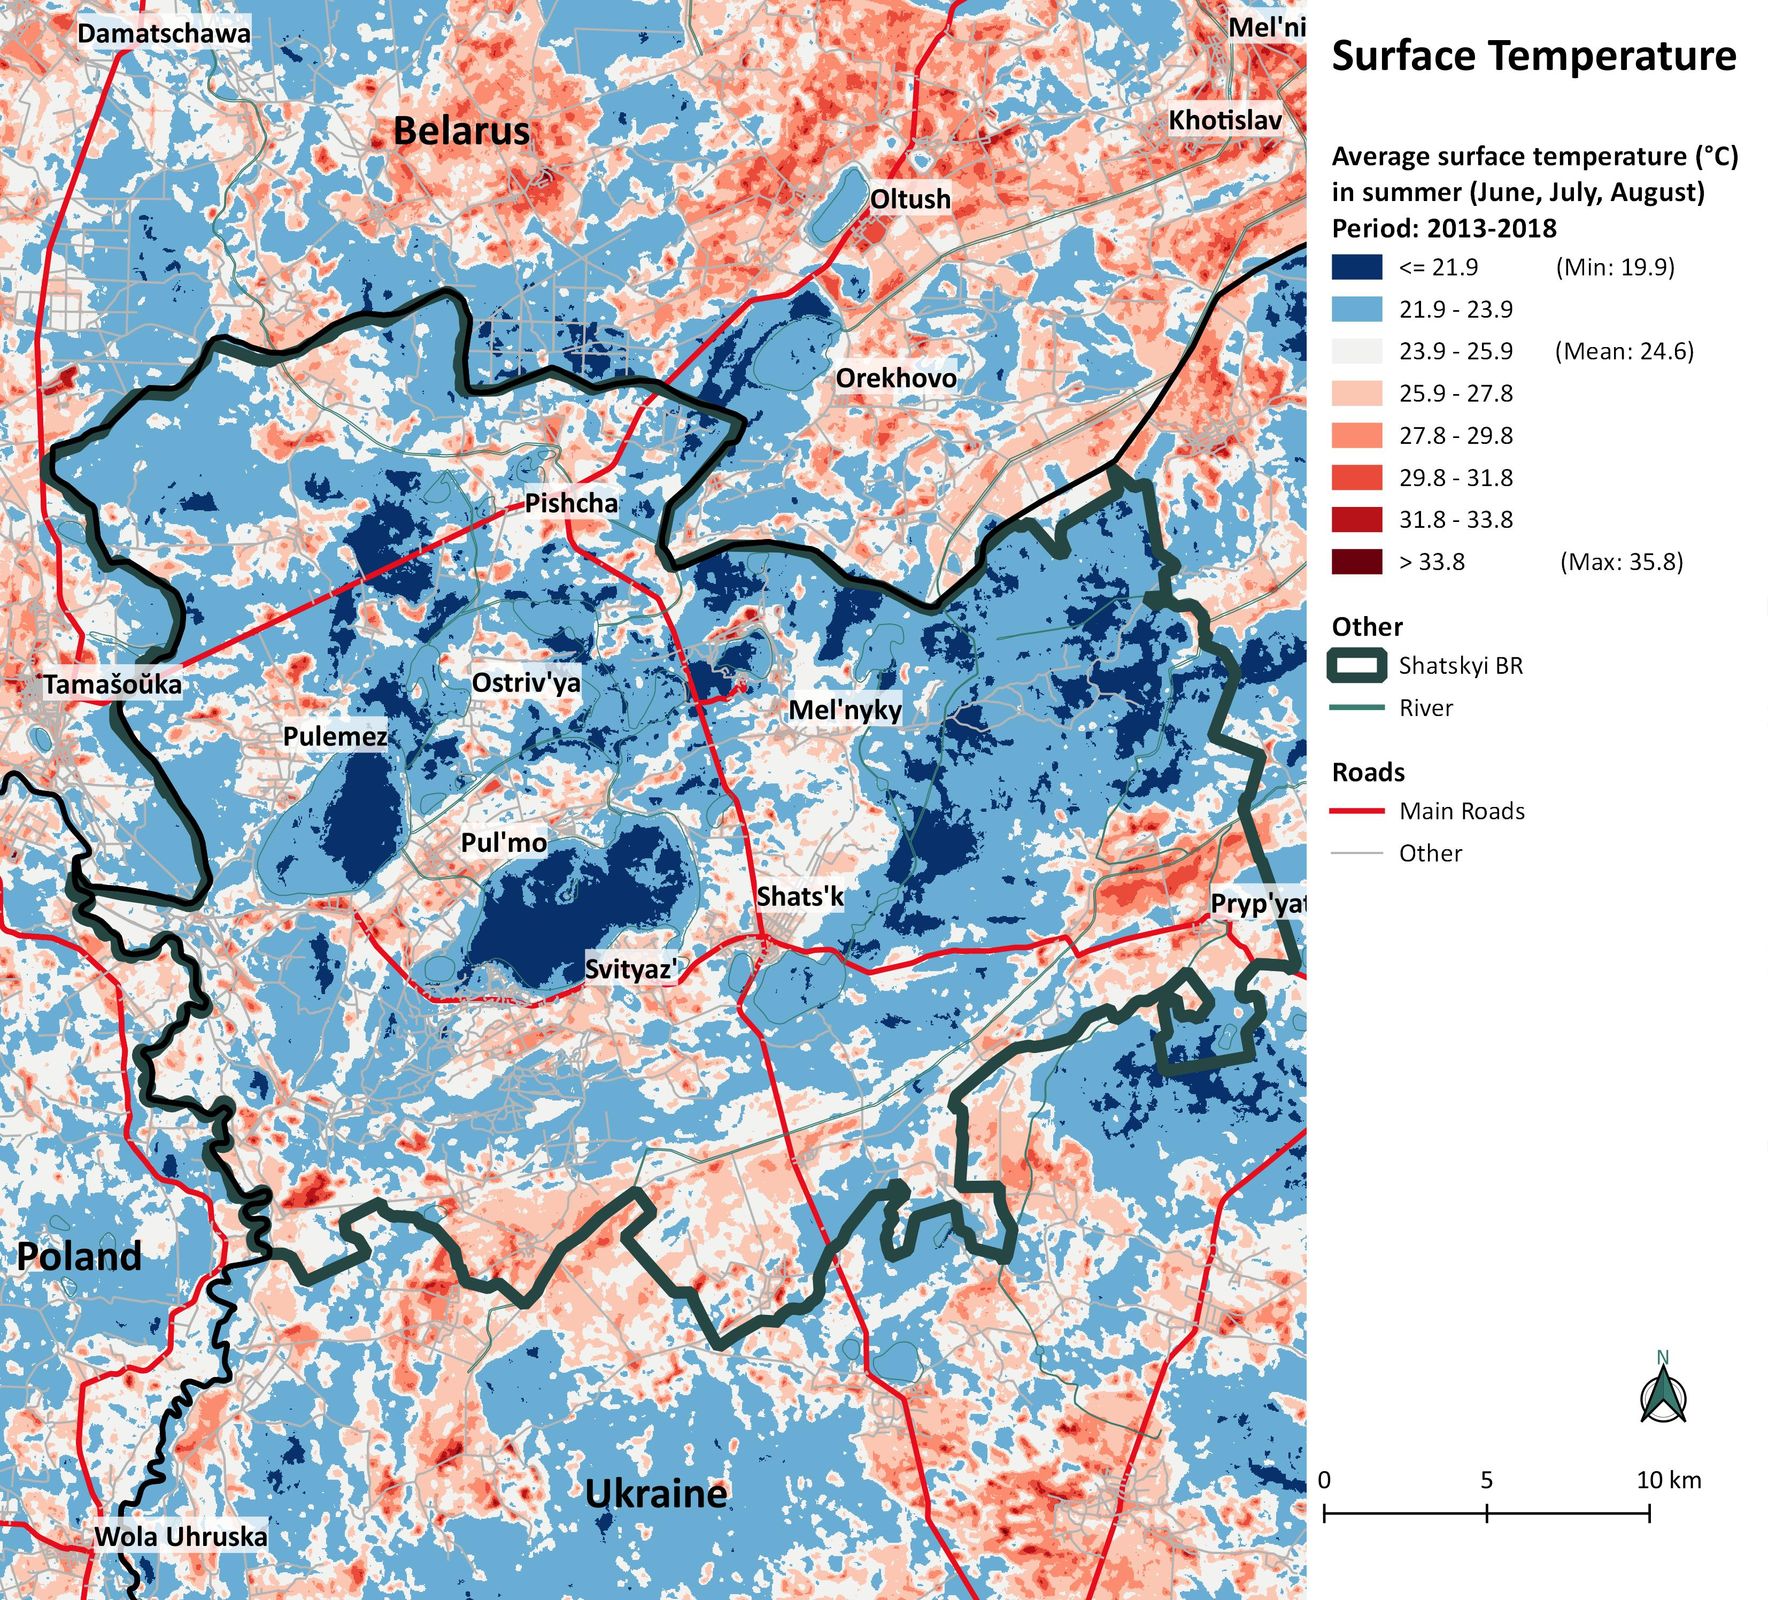
Climate Change, Exposure, and Impacts Shatskyi Biosphere Reserve
During the climatic normal period between 1961 and 1990 (standard reference) the average annual air temperature was about 7.4 oC. It reached the maximum of 9.5 oC and 9.1 oC in 1989 and 1990 respectively. In the last 28 years (1991-2018) the mean annual temperature increased to 8.5 oC, i.e. by 1.1 oC. It has been particularly high since 2014 exceeding each year value of 9.0 oC with a peak of 9.8 oC in 2015. The mean monthly temperature of the coldest and hottest months (i.e. January and July) in the periods of 1961-1990 and 1991-2018 were -4.6 vs -2.5 oC and 18.1 vs 19.8 oC respectively.
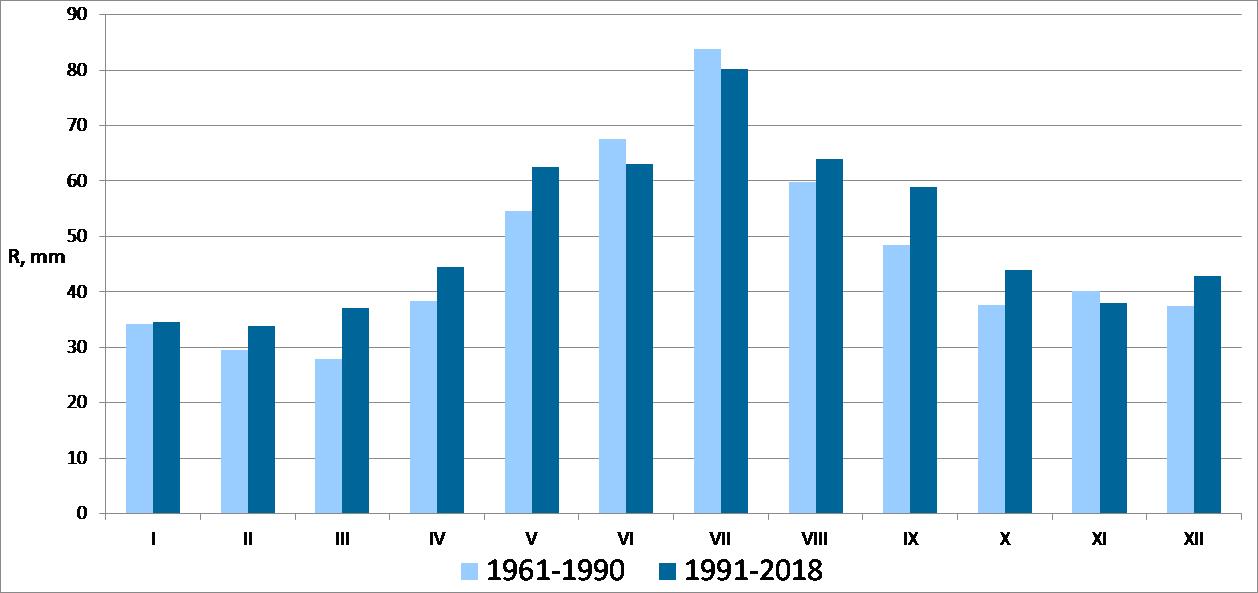
The highest increase in mean monthly temperatures in comparison to the climatic normal was observed for the winter (January & February) and summer months (July & August) (see the graph). Moreover, this trend has accelerated in the recent five years (2014-2018) when the highest temperature rise was calculated as more than 2.5 oC for February, March, August and December. It was particularly hot in August 2015 and July of 2014, when the average air temperature reached 21.9 and 21.2 oC respectively due to extreme heat waves those summer seasons. These values correspond to the past long-term average of Central-Eastern Ukraine within the steppe zone. In 2018 the summer days (maximum daily temperature exceeds 25 oC) were observed from April till September with a total number of 89 days per year comparing to 64 days average in 2014-2018.
The average annual amount of precipitation in the region of the biosphere reserve comparing to reference period and the last three decades increased by almost 8 % – from 559 to 603 mm. Moreover, amount of precipitation in eight out of twelve last years between 2007 and 2018 exceeded 120 % of the long-term average of 1961-1990. Most precipitation still falls during the summer season, but there are some changes in volume throughout the year. Between 1991 and 2018, a substantial increase in the amount of rainwater was recorded for spring months and September-October, while only three months (June, July and November) featured less precipitation compared to the climatic normal.
During the last five years, an average duration of a dry period was 9 days per month, with the longest consecutive period of 25 days in August 2015. The highest one-day precipitation usually falls in May - July and September - October with an average amount of 15-25 mm over 24 hours. Its absolute monthly maximum was recorded in May 2014 and July 2018 with more than 130 mm, which constituted more than 20% of annual precipitation those years. Comparing to other two BRs in average number of wet days (with snow or rain) in Shatskyi BR is much higher (ca. 160 days per year) meaning less duration of dry period, what, however, is hindered by low water-holding capacity of sandy soils. Due to the specific air circulation big, water bodies within Shatskyi BR moderate the adverse consequences of climate change on surrounding ecosystems providing them with cool and wet air flows.
Projection for the future
According to the most probable climate development scenarios for the Shatskyi region (B1 and A2 scenario of IPCC) the mean annual temperature is expected to increase by 2.0 and 4.6 °C respectively by the end of the 21st century in comparison to 2000-2010 average. They also indicate an increasing variability of the amount of precipitation, which might be challenging for the development of sustainable and adapted agriculture and forestry as well as tourism in the region.
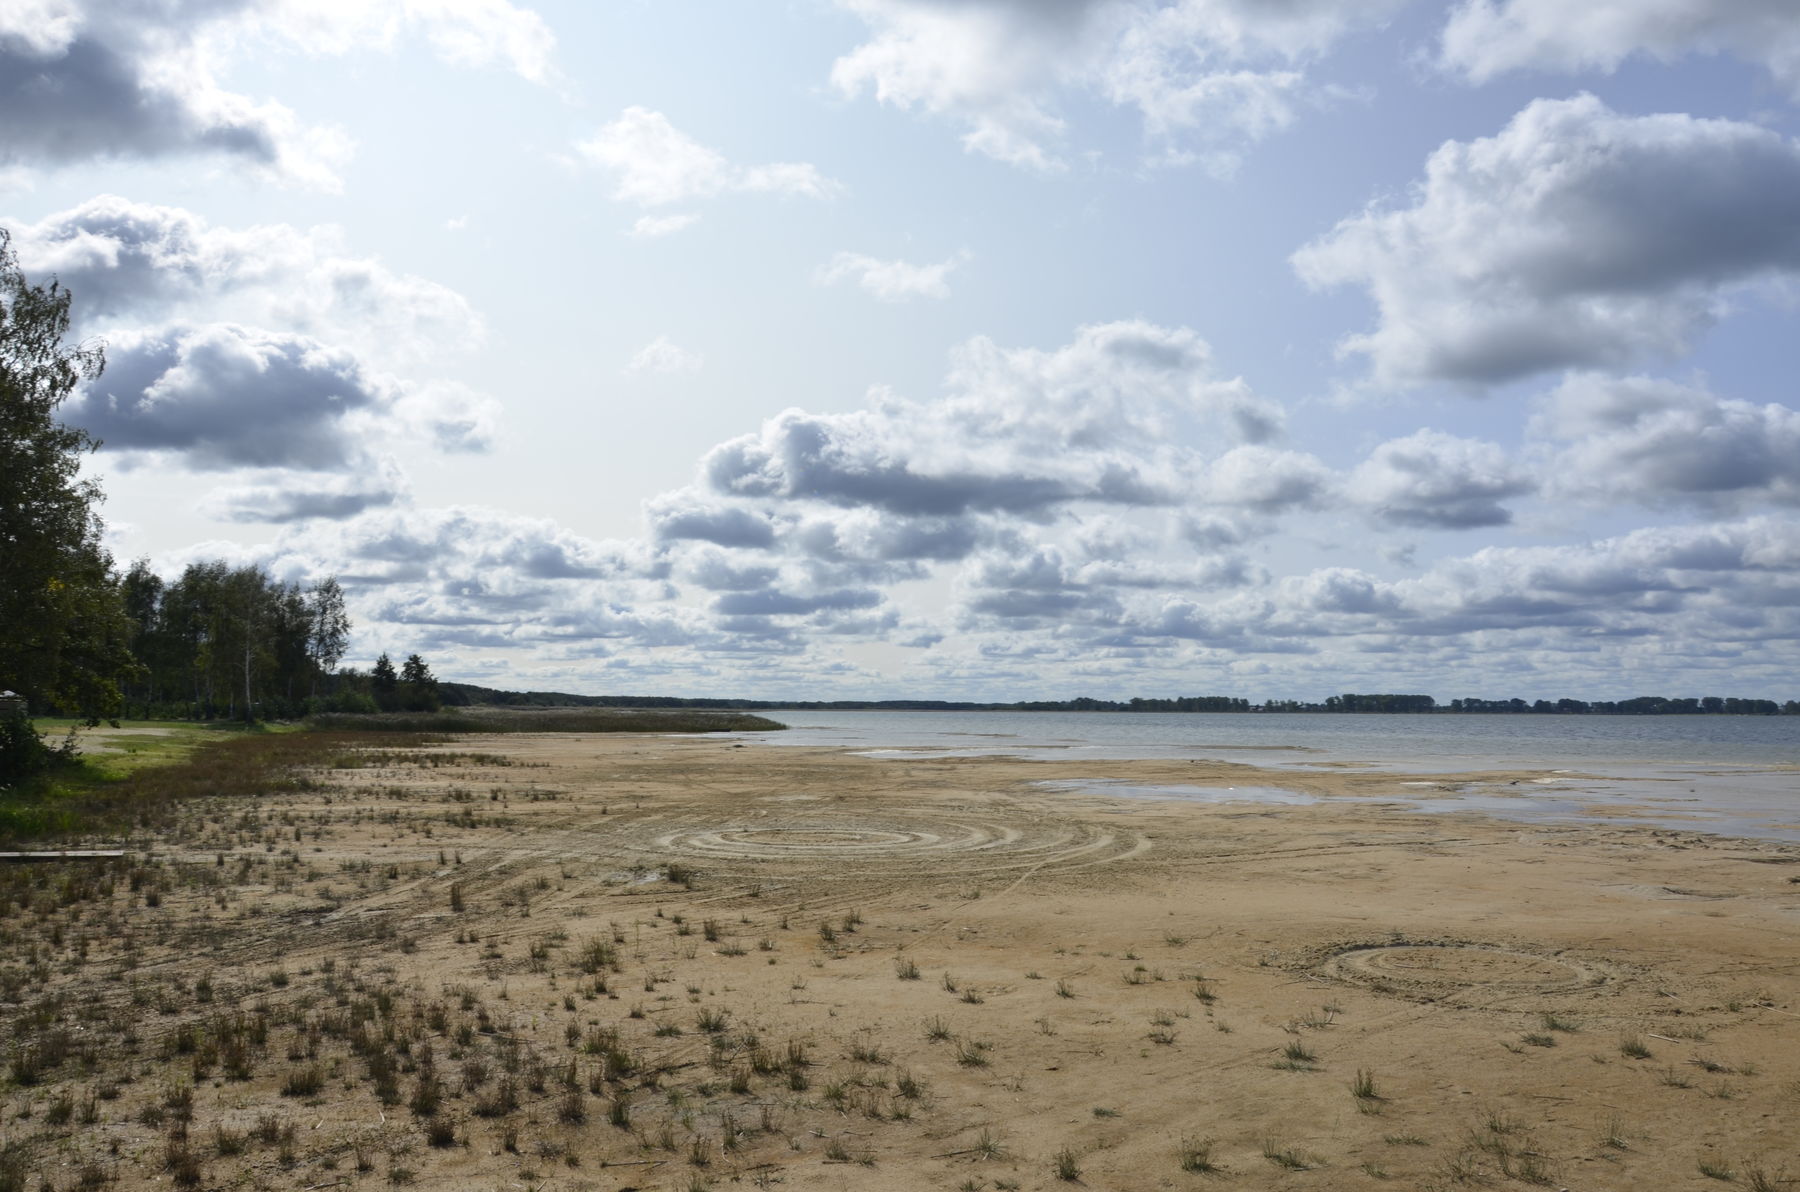
Hot and dry summers and mild winters without frost and snow have become more frequent on the territory of the BR, especially in the past five years. Increasing average temperatures, hot days, and drought periods drive evaporation and transpiration rates of water-bodies, soils, and plants, leading to landscape dehydration. Combined with changes in quantity and timing of precipitation, higher runoff rates, nearby mining activities, and unsustainable water use by agriculture and private households, the water balance is additionally under pressure. Significant was the water-level drop in 2019 of about two dozen lakes, including lake Svitiaz´, the largest lake within Shatskyi BR. It is considered the cleanest and deepest in Ukraine, recognized as one of the seven Ukrainian natural wonders and a favorite vacation spot. The level dropped by 38 cm below the observed normal of the past 35 years. Subsequent hot and dry years, as well as unchanged water-use, pose a major challenge for the lakes´ recovery.
Key impacts:
- Decreased levels of surface and groundwater are becoming evident in shallowing and drying of lakes, rivers, ponds, springs, and wells
- Rise of water temperature and eutrophication (accumulation of nutrients, e.g. via agricultural inputs)
- Low water quality (particles and toxins) and sedimentation
- Dehydration and desiccation of flora and fauna
Humans at risk:
- More frequent heatwaves and new maximum temperatures endanger the health of people, especially of sensitive groups. Not only humans but also plants and animals are stressed by heat, weaken, or die
- Diminishing quality and quantity of use- and drinking water
- Respiratory and cardiovascular diseases can result from heat or thermal stress
- Waterborne diseases
- Higher risk of fire and wildfire

Forests, swamps, meadows, and agricultural lands are also increasingly suffering from dehydration. The combination of dryer conditions due to climate change and unsustainable water use by humans increases the risk of fires. Especially in meadows and peat bogs a rising number of fires are being observed and monitored. The occurrence of forest fires remains low, yet the risk increases. Enabled by these conditions, fires are mostly triggered by inattentive humans or lightning strikes during thunderstorms.
Humans at risk:
- Dehydration and drying of diverse ecosystem types leading to more frequent fires can spur the amount of allergic and asthmatic diseases in the wider region
- Air pollution due to particles released into the atmosphere during fires can cause cardiovascular and pulmonary diseases and death
- Higher risk of wildfires - direct loss of lives and damages to infrastructure
Overall, a reduction in biodiversity is observed both related to climate change and human intrusions. Changes in wildlife, plant populations, and habitats are occurring. This includes the appearance of alien species, while the living conditions of native plant and animal species are deteriorating. A growing number of the spread of pests, diseases, and insect calamities are observed mostly in forest and agricultural ecosystems. Higher levels of insect populations destroying trees and crops are found in arid arrays. Monoculture pine forests are very vulnerable - the bark beetle population has now become a major threat to these stands.
Humans at risk:
- Diarrhea and infectious diseases, in which the pathogens are transmitted e.g. by mosquitoes or ticks (tick-borne borreliosis - Lyme disease, and encephalitis), are two disease patterns that can occur more frequently as the temperature gradually rises.
- Forest produce and crop damage or loss
- Increasing cases of allergies and allergic shocks
Climate change also drives an increase in the number of dangerous weather phenomena, such as heatwaves and droughts, torrential rain and flooding, storms, hail-, sand-,and snowstorms, frosts and icing in late spring. The ecosystems and humans, forming part of them, are affected at different levels, space, and time by the manifold consequences of such events.
Humans at risk:
- Direct damage to physical (and mental) well-being:
- E.g. flooding can cause mold/dampness provoking cough, phlegm, respiratory problems, and allergic reactions
- In heat and drought events, a drop in blood pressure can occur, the heart has to beat faster and the body loses considerable fluid through elevated perspiration
- Perceived temperature (humidity, wind speed, and irradiation conditions) can also have a significant health impact
- Material damage to infrastructure, houses, and private property
- Damages to crops, harvest, and business interruption
- Power supply shortages
- Accident rates increase and employee productivity falls
- etc.